| Mean wOBA Against for Pitchers by Prospect Rank | |||
| First & Post 215 Batters Faced | |||
| Prospect Rank | First 215 wOBA | Post 215 wOBA | Difference |
|---|---|---|---|
| 1 - 25 | 0.325 | 0.322 | -0.003 |
| 26 - 50 | 0.336 | 0.331 | -0.005 |
| 51 - 75 | 0.341 | 0.333 | -0.008 |
| 76 - 100 | 0.339 | 0.332 | -0.007 |
| Unranked | 0.335 | 0.341 | 0.006 |
| *Minimum Career Batters Faced = 860 | |||
5 wOBA Against Grades
5.1 Pitcher Scale
As noted, our scale for pitchers is inverted since a lower wOBA Against is better.
- Elite: .290 or below
- Great: .291 to .309
- Good: .310 to .319
- Average: .320 to .339
- Below Average: .340 to .369
- Poor: .370 to .399
- Awful: .400 or above
5.2 Kids’ Table (Pitchers)
Since pitchers are kind of weird in real life (in a good way) and because we had more fun at the kids’ table anyway, we’ll go ahead and start there this time!
| Mean wOBA Against for Pitchers by Prospect Rank | |||
| First & Post 860 Batters Faced | |||
| Prospect Rank | First 860 wOBA | Post 860 wOBA | Difference |
|---|---|---|---|
| 1 - 25 | 0.321 | 0.318 | -0.003 |
| 26 - 50 | 0.334 | 0.329 | -0.005 |
| 51 - 75 | 0.331 | 0.330 | -0.001 |
| 76 - 100 | 0.328 | 0.326 | -0.002 |
| Unranked | 0.330 | 0.334 | 0.004 |
| *Minimum Career Batters Faced = 2,580 | |||
| Total Pitchers by Prospect Rank | |||
| Number & Percentage of Pitchers with 860 & 2,580 Batters Faced | |||
| Prospect Rank | >= 860 BF | >= 2,580 BF | % of Pitchers |
|---|---|---|---|
| 1 - 25 | 66 | 59 | 89% |
| 26 - 50 | 44 | 39 | 89% |
| 51 - 75 | 47 | 36 | 77% |
| 76 - 100 | 34 | 25 | 74% |
| Unranked | 281 | 162 | 58% |
| *Pitchers with less than 860 career Batters Faced are not included. | |||
The first thing that immediately jumps out when comparing pitchers to batters is that pitching prospects ranked 1 - 25 are in a league of their own in terms of performance. With batters, top 25 prospects were fairly similar in wOBA to prospects ranked 26 to 50. For pitchers, prospects ranked 26 through 100 make up a big glob with little separation.
Again we see that ranked prospects on average 1) perform better generally and 2) improve upon their rookie performance compared to unranked prospects who as a group do not. The mean margin of improvement is smaller with pitchers compared to batters—about half.
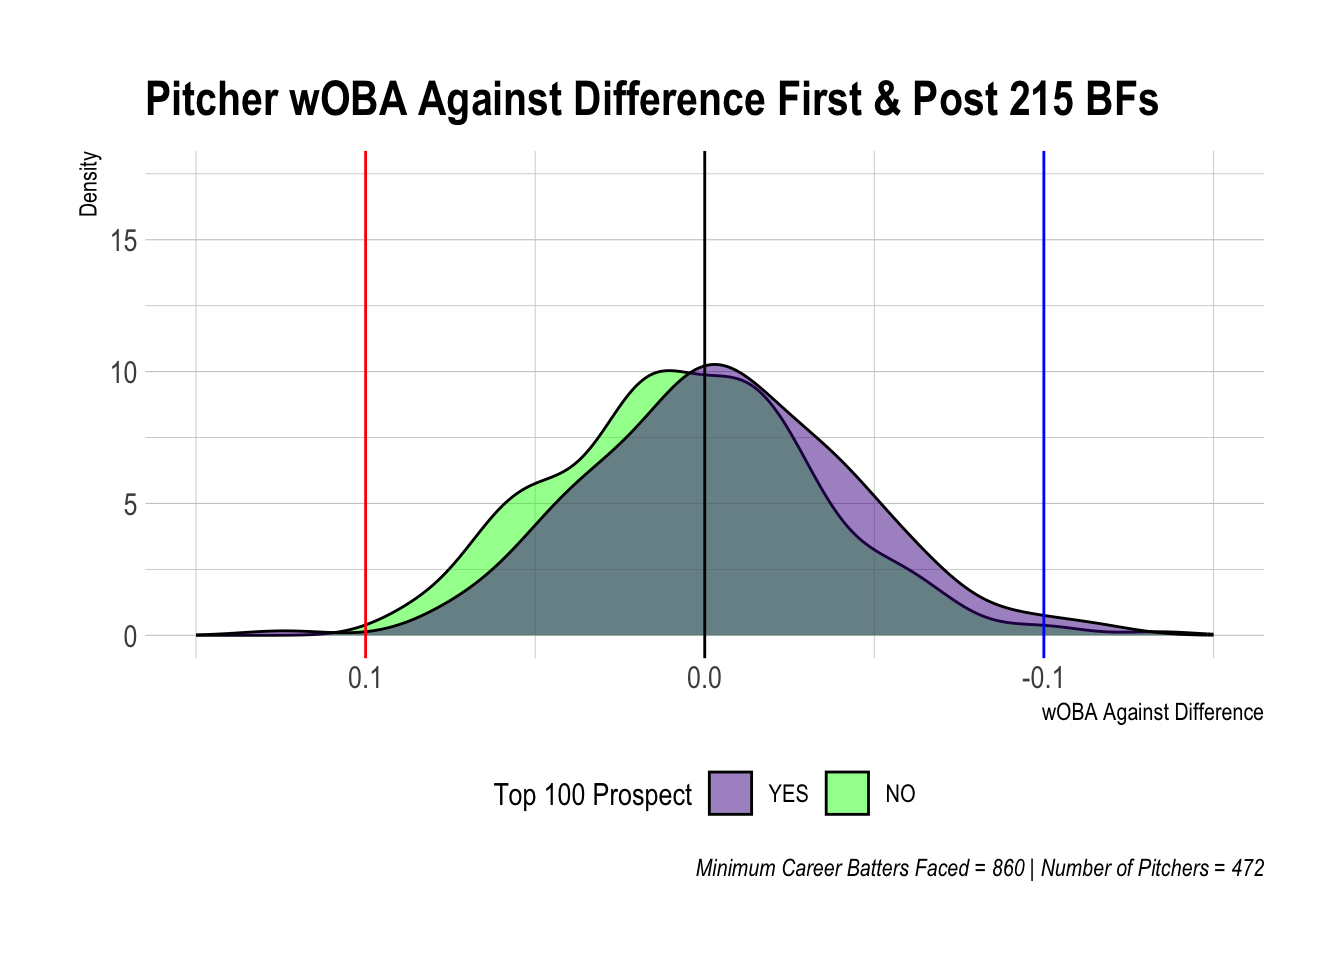
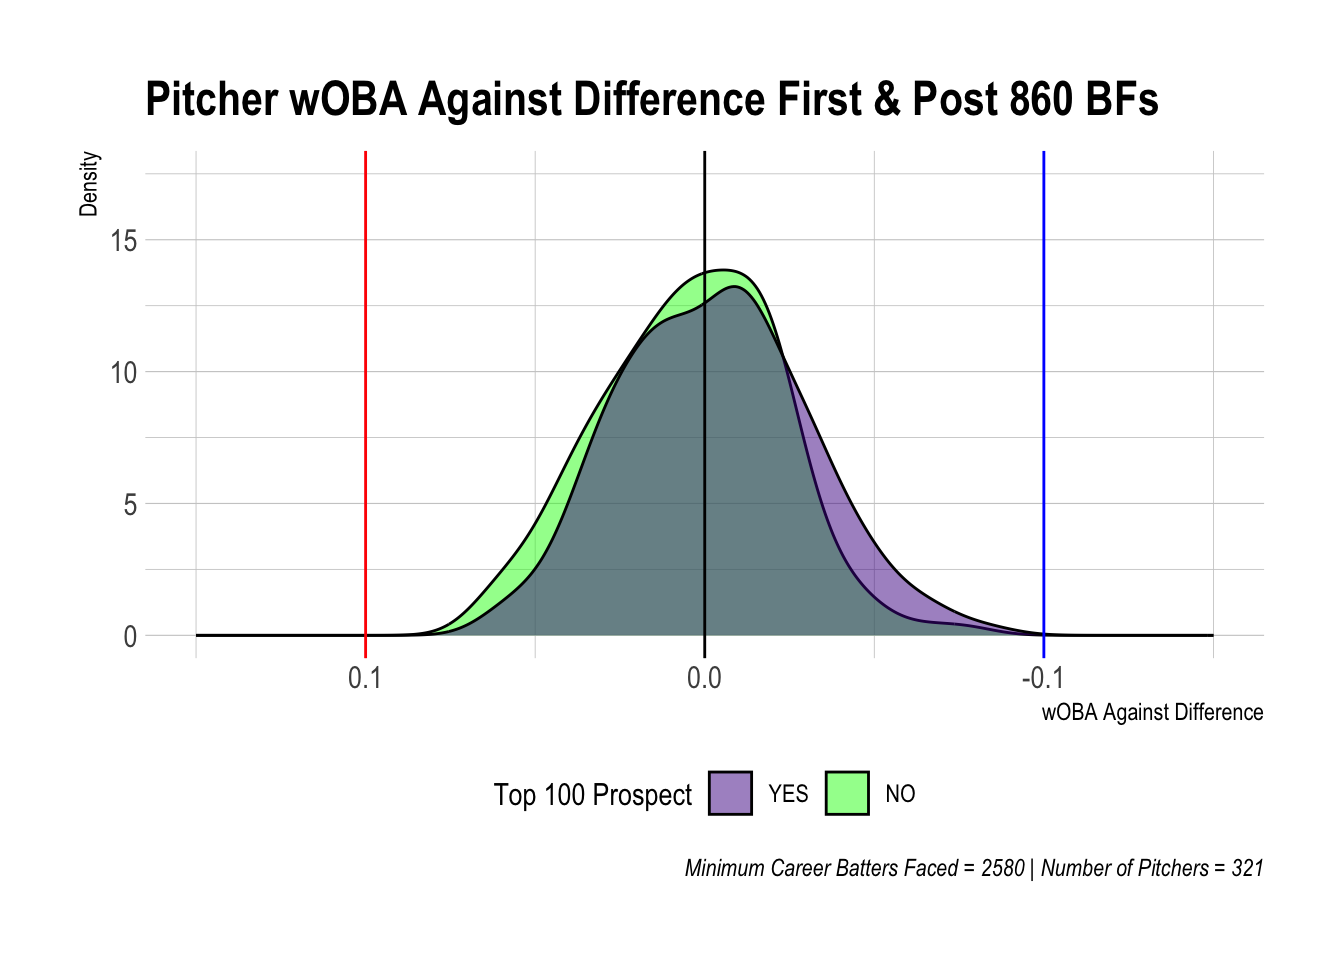
5.3 Change in wOBA Against
The density plots reinforce that top 100 prospects are improving more so than unranked prospects, although the distinction is not as great as it is with batters. Some of this can probably be explained by the fact that top 25 pitching prospects, the best group of pitchers, were pretty good from the get-go.
Note that the x-axis is reversed to demonstrate that pitchers decreasing their wOBA Against is better.
5.4 wOBA Against Grades - 860 BF
One piece that becomes evident quite quickly when looking at the percentage tables is that the number of pitchers represented is significantly less than the number of batters. Since we are focused only on starting pitchers, this cuts the number of pitchers down even further. With that said, you will see some grades that are entirely blank, meaning that no players had that initial wOBA Against grade.
The smaller “population” size also makes these tables less helpful. Many rows only include a few players, which doesn’t tell us much of anything.
| Percentage of Pitchers by wOBA Against Grades | |||||||||
| Prospect Rank: 1 to 25 | First & Post 860 Batters Faced | |||||||||
| Initial wOBA | Remaining Career wOBA | Total | |||||||
|---|---|---|---|---|---|---|---|---|---|
| Elite | Great | Good | Avg. | Below | Poor | Awful | DNQ | ||
| Elite | 29% | 43% | 14% | 14% | 0% | 0% | 0% | 0% | 7 |
| Great | 7% | 36% | 0% | 43% | 7% | 0% | 0% | 7% | 14 |
| Good | 20% | 20% | 10% | 30% | 20% | 0% | 0% | 0% | 10 |
| Average | 7% | 13% | 13% | 33% | 13% | 0% | 0% | 20% | 15 |
| Below Average | 6% | 11% | 17% | 39% | 17% | 0% | 0% | 11% | 18 |
| Poor | 0% | 0% | 0% | 0% | 50% | 0% | 0% | 50% | 2 |
| Awful | — | — | — | — | — | — | — | — | 0 |
| DNQ | 0% | 0% | 0% | 0% | 0% | 0% | 0% | 100% | 5 |
| Total | 10% | 20% | 10% | 31% | 13% | 0% | 0% | 17% | 71 |
| *Percentages are rounded and may not equal to exactly 100% across rows. | |||||||||
| Percentage of Pitchers by wOBA Against Grades | |||||||||
| Prospect Rank: 26 to 50 | First & Post 860 Batters Faced | |||||||||
| Initial wOBA | Remaining Career wOBA | Total | |||||||
|---|---|---|---|---|---|---|---|---|---|
| Elite | Great | Good | Avg. | Below | Poor | Awful | DNQ | ||
| Elite | — | — | — | — | — | — | — | — | 0 |
| Great | 0% | 0% | 20% | 40% | 40% | 0% | 0% | 0% | 5 |
| Good | 0% | 14% | 14% | 43% | 14% | 0% | 0% | 14% | 7 |
| Average | 0% | 14% | 21% | 21% | 36% | 0% | 0% | 7% | 14 |
| Below Average | 0% | 19% | 0% | 25% | 38% | 0% | 0% | 19% | 16 |
| Poor | 0% | 0% | 100% | 0% | 0% | 0% | 0% | 0% | 1 |
| Awful | 0% | 0% | 0% | 100% | 0% | 0% | 0% | 0% | 1 |
| DNQ | 0% | 0% | 0% | 0% | 0% | 0% | 0% | 100% | 7 |
| Total | 0% | 12% | 12% | 25% | 27% | 0% | 0% | 24% | 51 |
| *Percentages are rounded and may not equal to exactly 100% across rows. | |||||||||
| Percentage of Pitchers by wOBA Against Grades | |||||||||
| Prospect Rank: 51 to 75 | First & Post 860 Batters Faced | |||||||||
| Initial wOBA | Remaining Career wOBA | Total | |||||||
|---|---|---|---|---|---|---|---|---|---|
| Elite | Great | Good | Avg. | Below | Poor | Awful | DNQ | ||
| Elite | 25% | 25% | 25% | 0% | 25% | 0% | 0% | 0% | 4 |
| Great | 0% | 0% | 0% | 0% | 33% | 0% | 0% | 67% | 3 |
| Good | 20% | 20% | 0% | 20% | 20% | 0% | 0% | 20% | 5 |
| Average | 0% | 0% | 22% | 39% | 28% | 0% | 0% | 11% | 18 |
| Below Average | 0% | 7% | 0% | 36% | 21% | 0% | 0% | 36% | 14 |
| Poor | 0% | 0% | 0% | 0% | 67% | 0% | 0% | 33% | 3 |
| Awful | — | — | — | — | — | — | — | — | 0 |
| DNQ | 0% | 0% | 0% | 0% | 0% | 0% | 0% | 100% | 12 |
| Total | 3% | 5% | 8% | 22% | 22% | 0% | 0% | 39% | 59 |
| *Percentages are rounded and may not equal to exactly 100% across rows. | |||||||||
| Percentage of Pitchers by wOBA Against Grades | |||||||||
| Prospect Rank: 76 to 100 | First & Post 860 Batters Faced | |||||||||
| Initial wOBA | Remaining Career wOBA | Total | |||||||
|---|---|---|---|---|---|---|---|---|---|
| Elite | Great | Good | Avg. | Below | Poor | Awful | DNQ | ||
| Elite | 0% | 0% | 0% | 50% | 50% | 0% | 0% | 0% | 2 |
| Great | 0% | 0% | 0% | 0% | 100% | 0% | 0% | 0% | 2 |
| Good | 0% | 43% | 14% | 43% | 0% | 0% | 0% | 0% | 7 |
| Average | 10% | 0% | 10% | 20% | 20% | 0% | 0% | 40% | 10 |
| Below Average | 0% | 10% | 10% | 20% | 30% | 0% | 0% | 30% | 10 |
| Poor | 0% | 0% | 0% | 33% | 0% | 0% | 0% | 67% | 3 |
| Awful | — | — | — | — | — | — | — | — | 0 |
| DNQ | 0% | 0% | 0% | 0% | 0% | 0% | 0% | 100% | 13 |
| Total | 2% | 9% | 6% | 19% | 17% | 0% | 0% | 47% | 47 |
| *Percentages are rounded and may not equal to exactly 100% across rows. | |||||||||
| Percentage of Pitchers by wOBA Against Grades | |||||||||
| Prospect Rank: Unranked | First & Post 860 Batters Faced | |||||||||
| Initial wOBA | Remaining Career wOBA | Total | |||||||
|---|---|---|---|---|---|---|---|---|---|
| Elite | Great | Good | Avg. | Below | Poor | Awful | DNQ | ||
| Elite | 0% | 21% | 7% | 50% | 0% | 0% | 0% | 21% | 14 |
| Great | 0% | 11% | 0% | 53% | 21% | 0% | 0% | 16% | 19 |
| Good | 0% | 5% | 14% | 22% | 27% | 0% | 0% | 32% | 37 |
| Average | 0% | 4% | 4% | 22% | 30% | 0% | 0% | 41% | 79 |
| Below Average | 1% | 0% | 6% | 24% | 17% | 1% | 0% | 51% | 117 |
| Poor | 0% | 0% | 7% | 20% | 13% | 0% | 0% | 60% | 15 |
| Awful | — | — | — | — | — | — | — | — | 0 |
| DNQ | 0% | 0% | 0% | 0% | 0% | 0% | 0% | 100% | 208 |
| Total | 0% | 2% | 3% | 15% | 12% | 0% | 0% | 67% | 489 |
| *Percentages are rounded and may not equal to exactly 100% across rows. | |||||||||
When looking at the tables, there are a large number of pitchers comparatively who had a Below Average wOBA Against grade for their first 860 batters faced, roughly 200 innings pitched. The trajectory of their career after those marks helps illustrate the distinction between prospect ranks. Of those pitchers:
- 1 - 25 ranked prospects: 73% improved to Average or better pitchers
- 26 - 50 ranked prospects: 44% improved to Average or better pitchers
- 51 - 75 ranked prospects: 43% improved to Average or better pitchers
- 76 - 100 ranked prospects: 40% improved to Average or better pitchers
- Unranked prospects: 31% improved to Average or better pitchers
5.5 wOBA Against Grades - 215 BF
| Percentage of Pitchers by wOBA Against Grades | |||||||||
| Prospect Rank: 1 to 25 | First & Post 215 Batters Faced | |||||||||
| Initial wOBA | Remaining Career wOBA | Total | |||||||
|---|---|---|---|---|---|---|---|---|---|
| Elite | Great | Good | Avg. | Below | Poor | Awful | DNQ | ||
| Elite | 9% | 45% | 9% | 18% | 0% | 9% | 0% | 9% | 11 |
| Great | 8% | 25% | 25% | 42% | 0% | 0% | 0% | 0% | 12 |
| Good | 33% | 0% | 17% | 17% | 17% | 0% | 0% | 17% | 6 |
| Average | 8% | 17% | 17% | 42% | 17% | 0% | 0% | 0% | 12 |
| Below Average | 5% | 16% | 21% | 21% | 32% | 0% | 0% | 5% | 19 |
| Poor | 0% | 0% | 0% | 56% | 22% | 11% | 0% | 11% | 9 |
| Awful | 0% | 0% | 0% | 0% | 50% | 0% | 0% | 50% | 2 |
| DNQ | — | — | — | — | — | — | — | — | 0 |
| Total | 8% | 18% | 15% | 31% | 17% | 3% | 0% | 7% | 71 |
| *Percentages are rounded and may not equal to exactly 100% across rows. | |||||||||
| Percentage of Pitchers by wOBA Against Grades | |||||||||
| Prospect Rank: 26 to 50 | First & Post 215 Batters Faced | |||||||||
| Initial wOBA | Remaining Career wOBA | Total | |||||||
|---|---|---|---|---|---|---|---|---|---|
| Elite | Great | Good | Avg. | Below | Poor | Awful | DNQ | ||
| Elite | 0% | 33% | 0% | 33% | 33% | 0% | 0% | 0% | 3 |
| Great | 0% | 0% | 11% | 44% | 44% | 0% | 0% | 0% | 9 |
| Good | 0% | 50% | 0% | 25% | 0% | 0% | 0% | 25% | 4 |
| Average | 0% | 0% | 33% | 67% | 0% | 0% | 0% | 0% | 6 |
| Below Average | 0% | 5% | 5% | 30% | 35% | 0% | 0% | 25% | 20 |
| Poor | 0% | 14% | 0% | 43% | 43% | 0% | 0% | 0% | 7 |
| Awful | 0% | 0% | 100% | 0% | 0% | 0% | 0% | 0% | 1 |
| DNQ | 0% | 0% | 0% | 0% | 0% | 0% | 0% | 100% | 1 |
| Total | 0% | 10% | 10% | 37% | 29% | 0% | 0% | 14% | 51 |
| *Percentages are rounded and may not equal to exactly 100% across rows. | |||||||||
| Percentage of Pitchers by wOBA Against Grades | |||||||||
| Prospect Rank: 51 to 75 | First & Post 215 Batters Faced | |||||||||
| Initial wOBA | Remaining Career wOBA | Total | |||||||
|---|---|---|---|---|---|---|---|---|---|
| Elite | Great | Good | Avg. | Below | Poor | Awful | DNQ | ||
| Elite | 17% | 17% | 17% | 50% | 0% | 0% | 0% | 0% | 6 |
| Great | 33% | 0% | 0% | 0% | 67% | 0% | 0% | 0% | 3 |
| Good | 0% | 0% | 0% | 60% | 40% | 0% | 0% | 0% | 5 |
| Average | 0% | 8% | 8% | 33% | 42% | 0% | 0% | 8% | 12 |
| Below Average | 0% | 0% | 22% | 33% | 33% | 0% | 0% | 11% | 9 |
| Poor | 0% | 0% | 14% | 21% | 29% | 7% | 0% | 29% | 14 |
| Awful | 0% | 17% | 0% | 17% | 33% | 0% | 0% | 33% | 6 |
| DNQ | 0% | 0% | 0% | 0% | 0% | 0% | 0% | 100% | 4 |
| Total | 3% | 5% | 10% | 29% | 31% | 2% | 0% | 20% | 59 |
| *Percentages are rounded and may not equal to exactly 100% across rows. | |||||||||
| Percentage of Pitchers by wOBA Against Grades | |||||||||
| Prospect Rank: 76 to 100 | First & Post 215 Batters Faced | |||||||||
| Initial wOBA | Remaining Career wOBA | Total | |||||||
|---|---|---|---|---|---|---|---|---|---|
| Elite | Great | Good | Avg. | Below | Poor | Awful | DNQ | ||
| Elite | 0% | 25% | 0% | 50% | 25% | 0% | 0% | 0% | 4 |
| Great | 0% | 0% | 25% | 25% | 50% | 0% | 0% | 0% | 4 |
| Good | 0% | 0% | 0% | 50% | 25% | 0% | 0% | 25% | 4 |
| Average | 0% | 0% | 22% | 22% | 22% | 0% | 0% | 33% | 9 |
| Below Average | 0% | 17% | 17% | 8% | 25% | 8% | 0% | 25% | 12 |
| Poor | 0% | 14% | 29% | 14% | 29% | 0% | 0% | 14% | 7 |
| Awful | 0% | 0% | 0% | 33% | 0% | 33% | 0% | 33% | 3 |
| DNQ | 0% | 0% | 0% | 0% | 0% | 0% | 0% | 100% | 4 |
| Total | 0% | 9% | 15% | 21% | 23% | 4% | 0% | 28% | 47 |
| *Percentages are rounded and may not equal to exactly 100% across rows. | |||||||||
| Percentage of Pitchers by wOBA Against Grades | |||||||||
| Prospect Rank: Unranked | First & Post 215 Batters Faced | |||||||||
| Initial wOBA | Remaining Career wOBA | Total | |||||||
|---|---|---|---|---|---|---|---|---|---|
| Elite | Great | Good | Avg. | Below | Poor | Awful | DNQ | ||
| Elite | 2% | 4% | 9% | 29% | 31% | 0% | 0% | 24% | 45 |
| Great | 0% | 5% | 9% | 18% | 40% | 2% | 0% | 25% | 55 |
| Good | 0% | 3% | 6% | 26% | 26% | 9% | 3% | 26% | 34 |
| Average | 0% | 0% | 8% | 25% | 38% | 0% | 0% | 29% | 65 |
| Below Average | 0% | 2% | 4% | 25% | 35% | 4% | 0% | 31% | 118 |
| Poor | 0% | 3% | 1% | 19% | 31% | 7% | 0% | 39% | 70 |
| Awful | 7% | 0% | 0% | 27% | 33% | 0% | 0% | 33% | 15 |
| DNQ | 0% | 0% | 0% | 0% | 0% | 0% | 0% | 100% | 87 |
| Total | 0% | 2% | 4% | 19% | 28% | 3% | 0% | 43% | 489 |
| *Percentages are rounded and may not equal to exactly 100% across rows. | |||||||||
5.6 Takeaways
The primary takeaway for pitchers is simply a reinforcement of what we already learned about batters. The better a prospect, the better their chances at more success in the major leagues and improving upon their initial performance.
In particular for pitchers, top 25 prospects reign supreme. Top 25 pitching prospects were the most likely of any prospect group for both batters and pitchers to have an Elite or Great wOBA/wOBA Against grade after their first 150 plate appearances or 215 batters faced (26% compared to the next closest group at 14%—top 25 hitting prospects). So essentially one in four top 25 pitching prospects become aces or frontline starters as measured by wOBA Against.